Lab 02 - LIDAR: Cones detection
Robotics II
Poznan University of Technology, Institute of Robotics and Machine Intelligence

Laboratory 2: Cones detection using LIDAR sensor
Back to the course table of contents
1. Introduction to LIDAR sensor
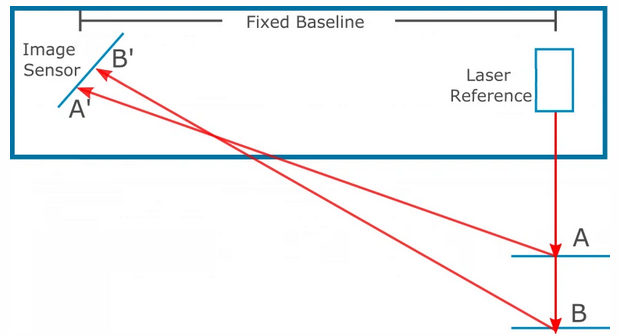
The laser scanner is a sensor that emits an infrared beam and then records the reflection of a given beam. There are 3 common ways how sensors work: - triangulation - laser emits beam and camera receiver checks the difference in the distance as changes in an angle of the received signal. Unequal measurement - closer distances are more accurately measured. Limited range of sensor due to base size and position. Image reference: How Do 3D Scanners Work?.
- amplitude-modulated continuous wave (AMCW) - continuous emitting of the laser beam with signal amplitude modulation. Distance is measured as the phase difference between signals emitted and received. Unambiguous results only for range 0 to 2π. The sensor range can be extended at the cost of reduced resolution. The figure below illustrates method of a measurement (image reference Review of advances in LiDAR detection and 3D imaging).

- time-of-flight (ToF) - sensor measures the time difference between the emission of a beam and its receiving. Accuracy is not dependent on distance to an obstacle.
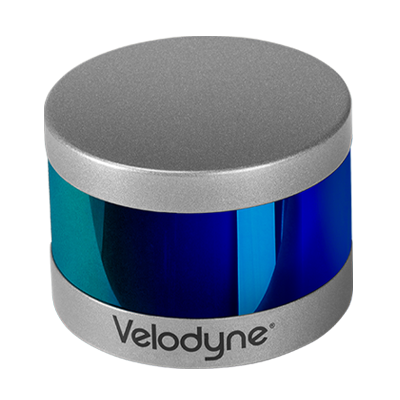
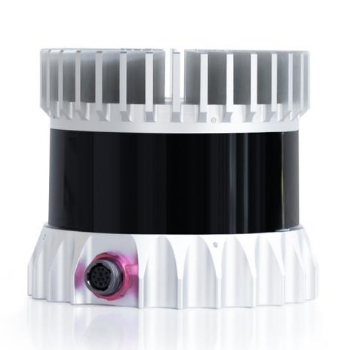
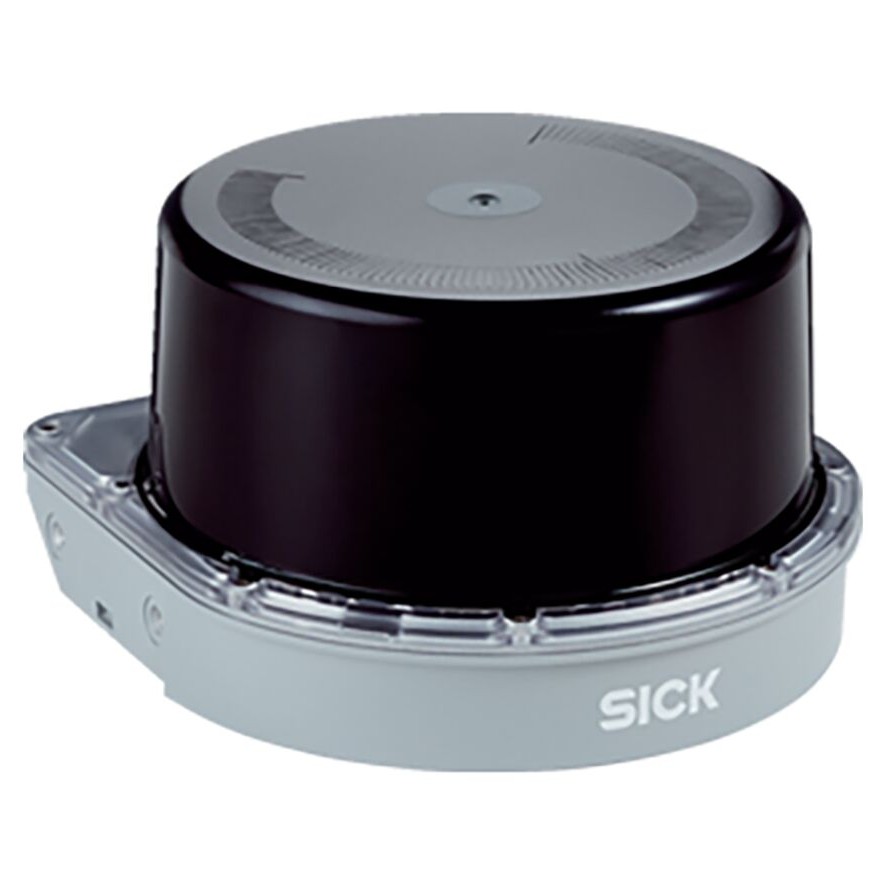
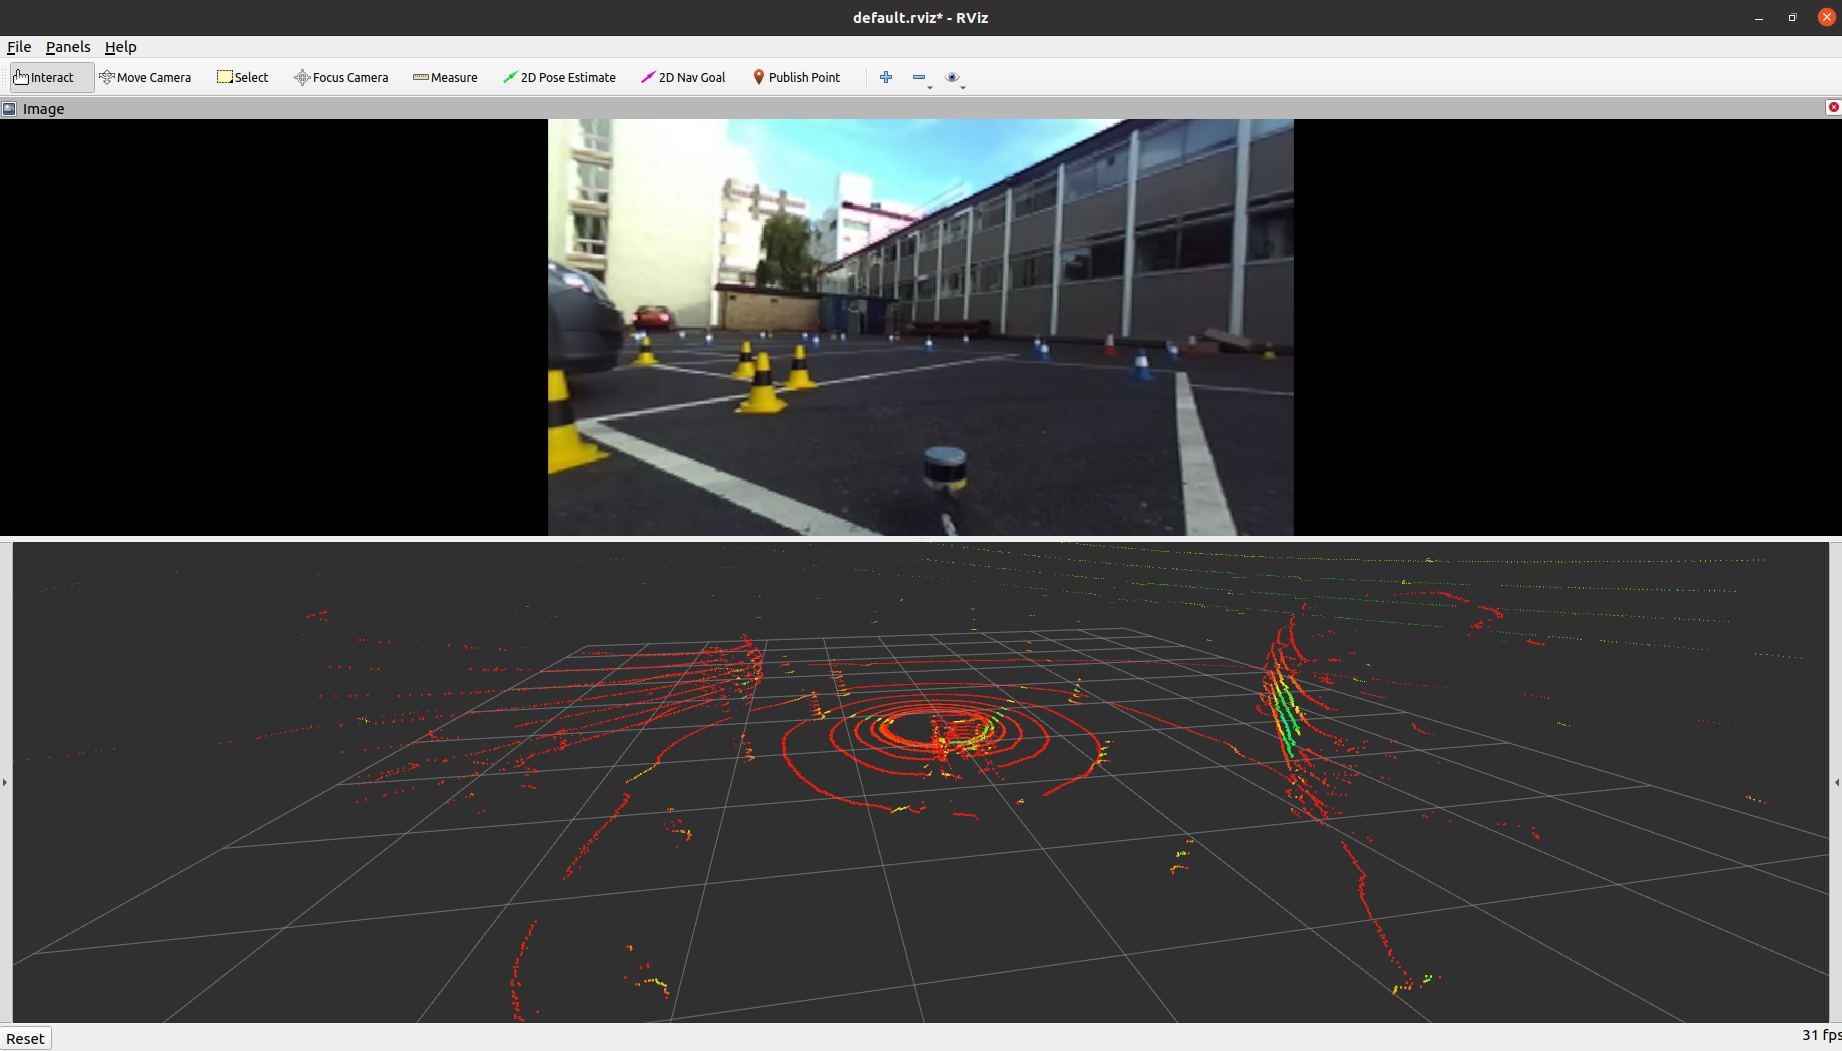
Below are shown examples of 3D laser scanners which use the ToF method - accordingly Velodyne VLP-16, Ouster OS1, and SICK MRS1000.
2. PointCloud2 Message
PointCloud2 Message is a part of sensor_msgs ROS package. Message consists of std_msgs/Header header which for every single message has unique ID, timestamp and name associated with frame. The raw PointCloud2 message definition is showed below:
# This message holds a collection of N-dimensional points, which may
# contain additional information such as normals, intensity, etc. The
# point data is stored as a binary blob, its layout described by the
# contents of the "fields" array.

# The point cloud data may be organized 2d (image-like) or 1d
# (unordered). Point clouds organized as 2d images may be produced by
# camera depth sensors such as stereo or time-of-flight.

# Time of sensor data acquisition, and the coordinate frame ID (for 3d
# points).
Header header

# 2D structure of the point cloud. If the cloud is unordered, height is
# 1 and width is the length of the point cloud.
uint32 height
uint32 width

# Describes the channels and their layout in the binary data blob.
PointField[] fields

bool    is_bigendian # Is this data bigendian?
uint32  point_step   # Length of a point in bytes
uint32  row_step     # Length of a row in bytes
uint8[] data         # Actual point data, size is (row_step*height)

bool is_dense        # True if there are no invalid points
3. Tasks
At the beginning
- Check if the container with your index number exists:
docker ps -a.
- If so, wake up your container using
docker start <YOUR_INDEX_ID>. Next, you can attach using thedocker exec -it <YOUR_INDEX_ID> bashcommand.
- In another case, use the 01-course instruction and create it.
- Inside the container, go to the
/home/fsdssim_user/Formula-Student-Driverless-Simulator/ros/src/RoboticsII-FSDSdirectory and perform thegit pullcommand to check changes.
Task
Familiarise yourself with PointCloud2 message returned by lidar sensor using
rostopic echocommand. Check how much data are received and which type they are. Compare returned sensor message with initial setup described insettings.jsonfile which is inFormula-Student-Driverless-Simulatordirectory. Check how many laser beams are used, points are recived and which different data fields are in message. AirSim lidar configuration is available on Docs » Using AirSim » Sensors » LIDAR.According to the pseudo-code shown below complete the
find_conesmethod (inFormula-Student-Driverless-Simulator/ros/src/fsds_roboticsII/scripts/lidar_detector.py) which groups close points in the target range and removes points that are above the limit distance.
cone <- []
current_group <- []

i <- 0
previous_point <- points[i]

FOR 1 TO len(points)
  i <- i + 1
  current_point <- points[i]

  distance_to_last_point <- distance(current_point_x, current_point_y, previous_point_x, previous_point_y)

  IF distance_to_last_point < 0.1
    current_group.append(current_point)
  ELSE
    IF current_group > 0
      cone <- points_group_to_cone(current_group)

      distance_to_cone <- distance(0, 0, cone_position_x, cone_position_y)

      IF distance_to_cone < cones_range_cutoff
        cones.append(cone)

      current_group <- []

      ENDIF
    ENDIF
  ENDIF

  previous_point <- current_point
ENDFOR
In function
distance(lidar_detector.pyscript) implement euclidean distance calculation between two ponits from PointCloud2 message in XY-plane (skip Z axis value).Create a cone pose class by grouping points that belong to the same cone using the
points_group_to_conemethod. Calculate average X and Y value of group and assign topoints_group_average_xandpoints_group_average_yvariables.Test completed lidar cones detector code in simulator’s container using
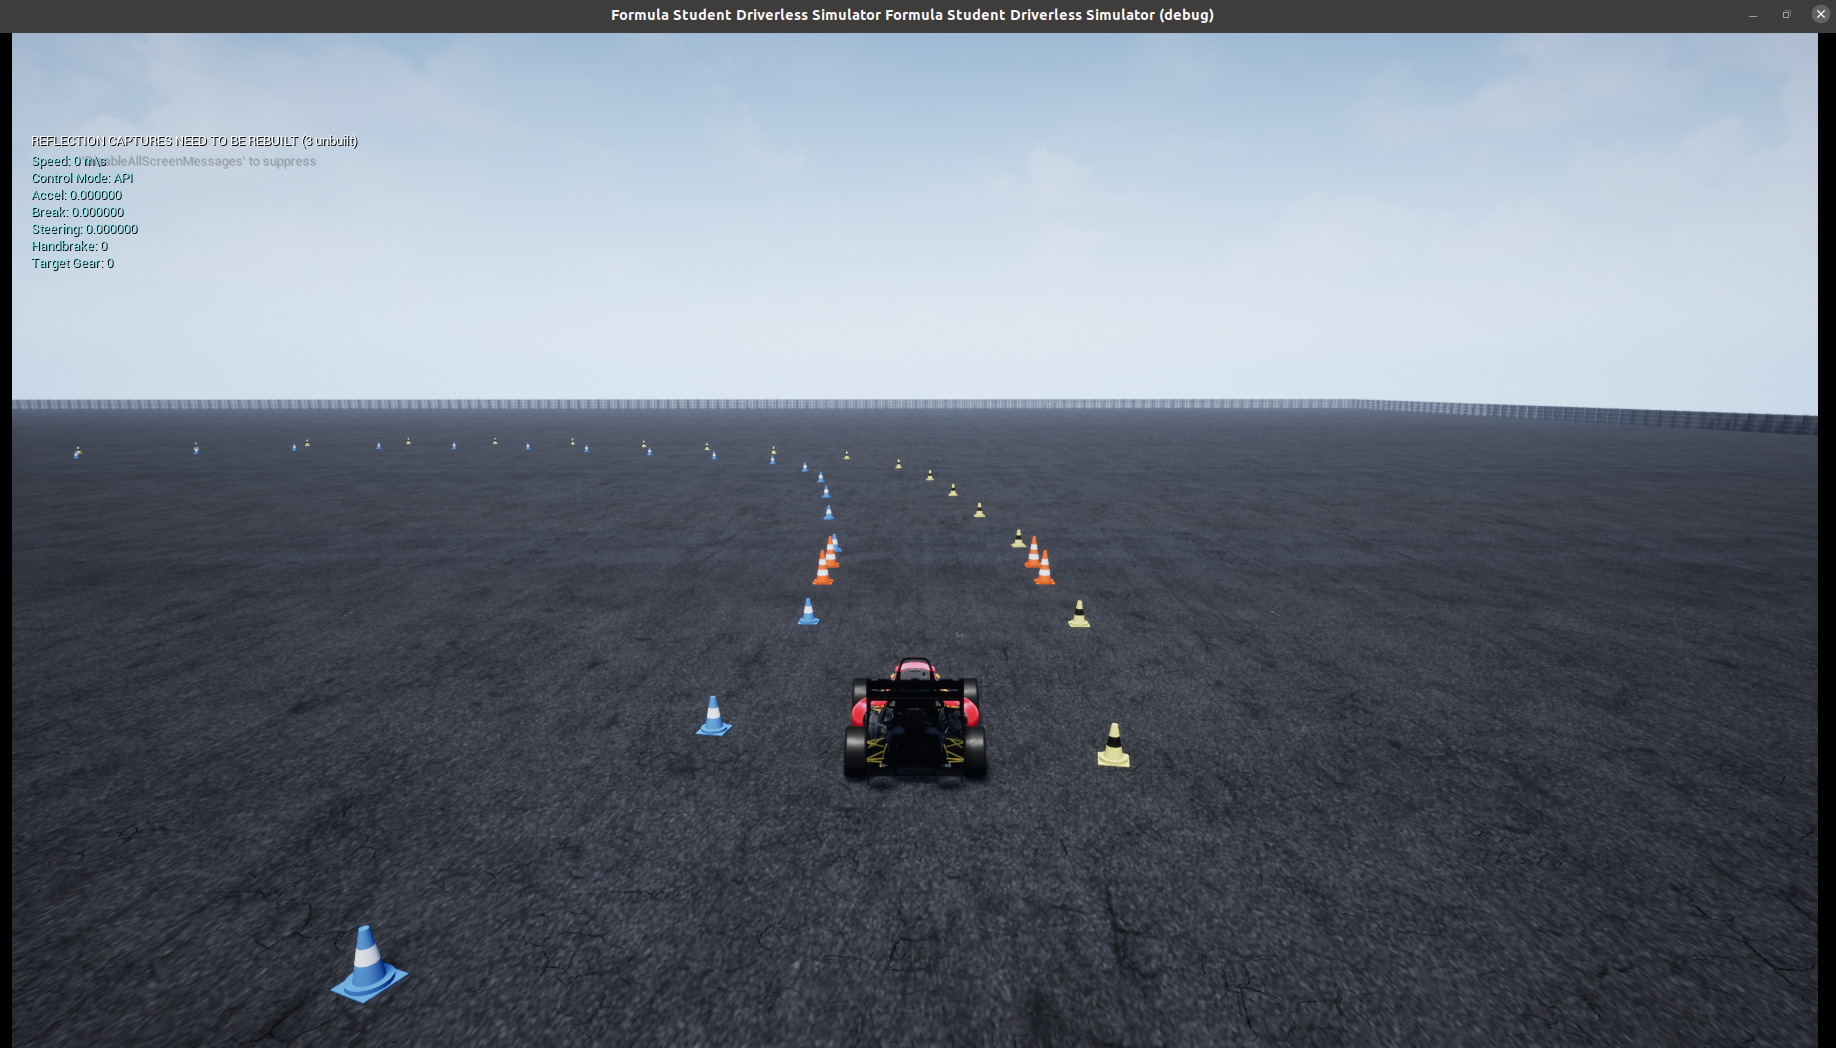
roslaunch fsds_roboticsII lidar_detector.launch(source ROS workspace if needed). The visualization of the end effect is depicted below.
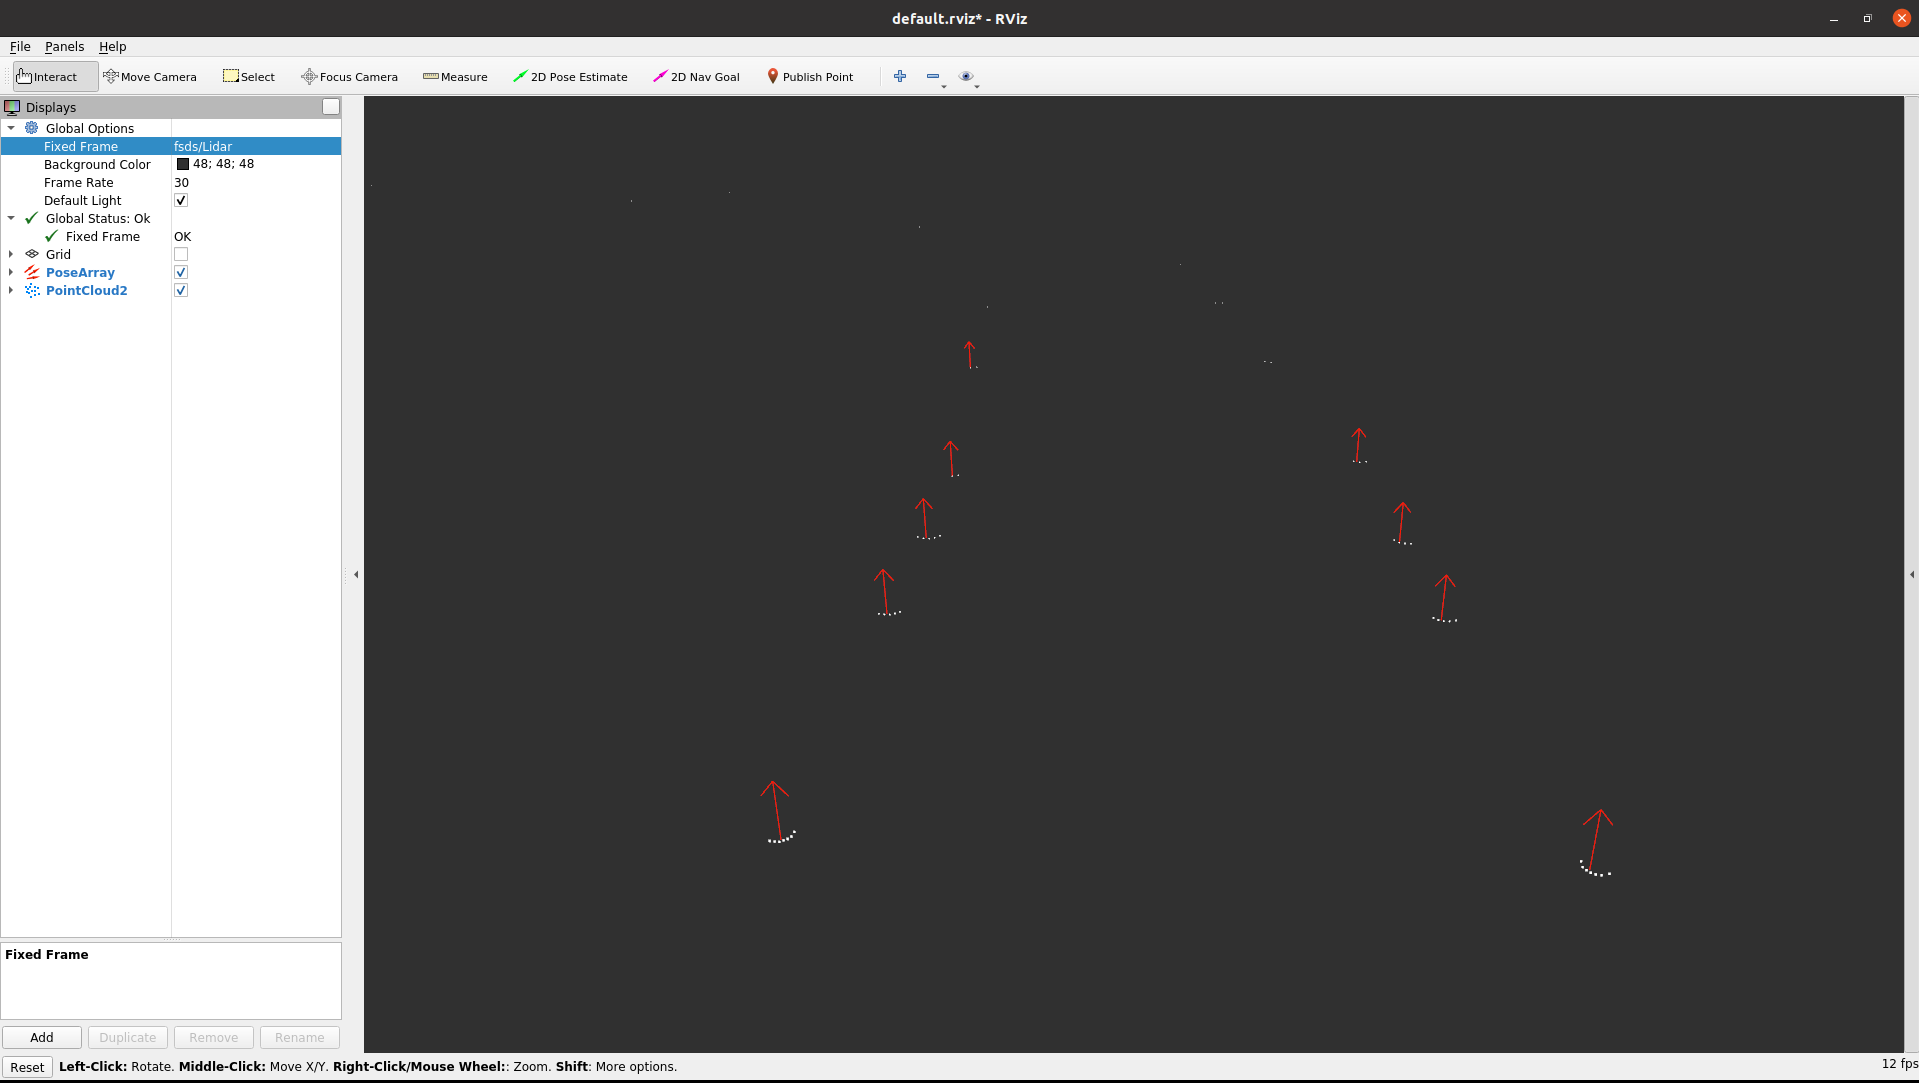
- Add to the eKursy platform screenshot of Rviz viewer with added PointCloud2 message from Lidar sensor and Pose Array with detected cones (colored arrows in the center of the detected cone - as figure above).